Debugging
Please have a look at the debugging options for your compilers, which allow to add debugging information into the executable. This makes the executable larger, but for debugging purposes that allows to read the source code where it happens. Sometimes and depending on your code the compiler will change your code due to the optimization flags. Please consider removing them for debugging.
Coredump
What is a coredump ?
A core dump is a file containing a process's address space (memory) when the process terminates unexpectedly. Core dumps may be produced on-demand (such as by a debugger), or automatically upon termination. Core dumps are triggered by the kernel in response to program crashes, and may be passed to a helper program (such as systemd-coredump) for further processing. A core dump is not typically used by an average user, but may be passed on to developers upon request where it can be invaluable as a post-mortem snapshot of the program's state at the time of the crash, especially if the fault is hard to reliably reproduce. coredump@ArchWiki
Most of our servers and the VSC have the coredump service available. You can check that simply by running coredumpctl, which should be available if it is installed.
on most systems the core dump is limited, run ulimit -c to see how large your core dump can be. Some systems allow to change these by the user with ulimit -c [number]. This needs to be set before the core file is dumped.
Core dumps are configured to persist for at least 3 days, before they are automatically cleaned.
coredump utilities
As a user you can only access your own coredump information, available dumps can be found like this.
| Bash | |
|---|---|
1 2 3 4 5 6 7 | |
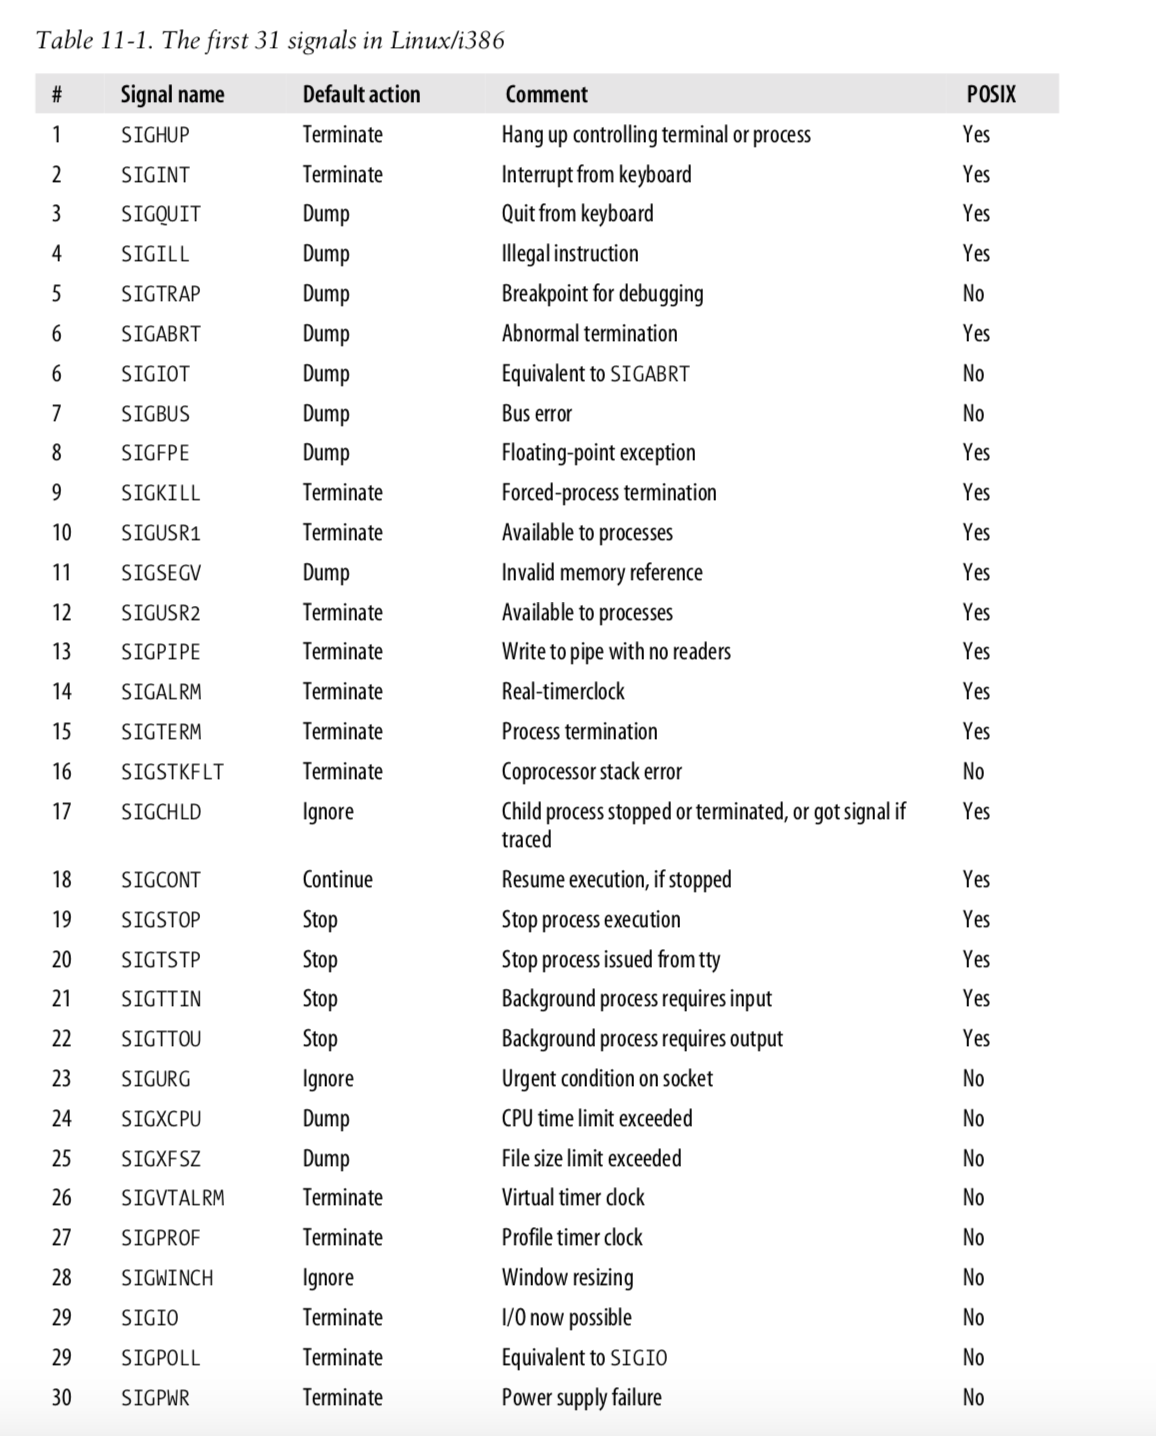
Relevant are especially the SIG and the COREFILE column, which give you a reason why your process was killed. Please find some useful information on the Signal in the table below. If COREFILE is none then the system probably disabled that or the ulimit is 0. If truncated, then the ulimit is too small for your dump core. If present, then the file can be used for debugging.
Test a coredump
Use the following C program to create a coredump and look at it. The program does something wrong. Maybe you can figure it out.
| C | |
|---|---|
1 2 3 4 5 6 | |
Write to a file called test_coredump.c and compile
# compile (with -g for debugging information)
[user@srvx1 ~]$ gcc -g -o test_coredump.x test_coredump.c
# execute
[user@srvx1 ~]$ ./test_coredump.x
Segmentation fault (core dumped)
# check the coredump
[user@srvx1 ~]$ coredumpctl
 TIME                            PID   UID   GID SIG COREFILE  EXE
Wed 2022-08-24 14:09:10 CEST 512174    1234  100  11 present   /home/user/test_coredump.x
# inspect the core dump
[user@srvx1 ~]$ coredumpctl info 512174
Hint: You are currently not seeing messages from other users and the system.
      Users in groups 'adm', 'systemd-journal', 'wheel' can see all messages.
      Pass -q to turn off this notice.
           PID: 512174 (test_coredump.x)
           UID: 1234 (user)
           GID: 100 (users)
        Signal: 6 (ABRT)
     Timestamp: Wed 2022-08-24 14:57:00 CEST (9min ago)
  Command Line: ./test_coredump.x
    Executable: /home/user/Documents/test_coredump.x
 Control Group: /user.slice/user-1234.slice/session-257306.scope
          Unit: session-257306.scope
         Slice: user-1234.slice
       Session: 257306
     Owner UID: 1234 (user)
       Boot ID: 521d3ca4537d4cdb92bc4eefba12072a
    Machine ID: e9055dc0f93045278fcbdde4b6828bc8
      Hostname: srvx1.img.univie.ac.at
       Storage: /var/lib/systemd/coredump/core.test_coredump\x2ex.1234.521d3ca4537d4cdb92bc4eefba12072a.512174.1661345820000>
       Message: Process 512174 (test_coredump.x) of user 1234 dumped core.

                Stack trace of thread 512174:
                #0  0x00007f637fc4737f raise (libc.so.6)
                #1  0x00007f637fc31db5 abort (libc.so.6)
                #2  0x00007f637fc8a4e7 __libc_message (libc.so.6)
                #3  0x00007f637fc915ec malloc_printerr (libc.so.6)
                #4  0x00007f637fc9189c munmap_chunk (libc.so.6)
                #5  0x000000000040059a main (test_coredump.x)
                #6  0x00007f637fc33493 __libc_start_main (libc.so.6)
                #7  0x00000000004004ce _start (test_coredump.x)
This tells you where the core dump is and a bit of a stack trace as well. Let's have a look at the dump file.
# run gdb with the core dump file [user@srvx1 ~]$ coredumpctl gdb 512174 ... This GDB was configured as "x86_64-redhat-linux-gnu".[20/29541]Type "show configuration" for configuration details. ... Reading symbols from /home/user/Documents/test_coredump.x...done. Core was generated by `./test_coredump.x'. Program terminated with signal SIGABRT, Aborted. #0 0x00007f1a84fd137f in raise () from /lib64/libc.so.6 (gdb) # now let's have a look at where we are. (gdb) l 1 #include2 #include 3 void main(){ 4 int x; 5 free(&x); 6 } # let's run the program and see what problems it has (gdb) r Starting program: /home/user/Documents/test_coredump.x ... munmap_chunk(): invalid pointer Program received signal SIGABRT, Aborted. 0x00007ffff7a4237f in raise () from /lib64/libc.so.6 (gdb) # so we ask the debugger where that happens: (gdb) where #0 0x00007ffff7a4237f in raise () from /lib64/libc.so.6 #1 0x00007ffff7a2cdb5 in abort () from /lib64/libc.so.6 #2 0x00007ffff7a854e7 in __libc_message () from /lib64/libc.so.6 #3 0x00007ffff7a8c5ec in malloc_printerr () from /lib64/libc.so.6 #4 0x00007ffff7a8c89c in munmap_chunk () from /lib64/libc.so.6 #5 0x000000000040059a in main () at test_coredump.c:5 # and because that is not totally clear, we can do a backtrace (gdb) bt full #0 0x00007ffff7a4237f in raise () from /lib64/libc.so.6 No symbol table info available. #1 0x00007ffff7a2cdb5 in abort () from /lib64/libc.so.6 No symbol table info available. #2 0x00007ffff7a854e7 in __libc_message () from /lib64/libc.so.6 No symbol table info available. #3 0x00007ffff7a8c5ec in malloc_printerr () from /lib64/libc.so.6 No symbol table info available. #4 0x00007ffff7a8c89c in munmap_chunk () from /lib64/libc.so.6 No symbol table info available. #5 0x000000000040059a in main () at test_coredump.c:5 x = 0 # a x is an integer, not malloc'ated, thus no free
Problem solved. We can not free something that is not allocated.